2019 GIS Kikuuyugrass
Wendy and Larry both participated in the Kikuyugrass A-Z session at the Golf Industry Show (GIS) this year. In addition, Pat Gross from the USGA, Fernando Varela from Guadalajara Country Club, Pat Gradoville from Palos Verdes Golf Club, and Dr. Marta Pudzianowska from UC Riverside provided some great information. The presentations are available at the links below:
- Kikuyugrass from A to Z - Climate and diseases by Larry Stowell, Ph.D
- Kikuyugrass from A to Z - Nutrition by Larry Stowell, Ph.D
- Kikuyugrass from A to Z - Insects by Wendy Gelernter
- Kikuyugrass from A to Z by Fernando Varela
- Kikuyugrass from A to Z by Pat Gradoville, CGCS
- Kikuyugrass from A to Z by Marta Pudzianowska, Ph.D
- Kikuyugrass from A to Z by Pat Gross
- Kikuyugrass Management Survey 2010
Growth potential for C3 and C4 grasses
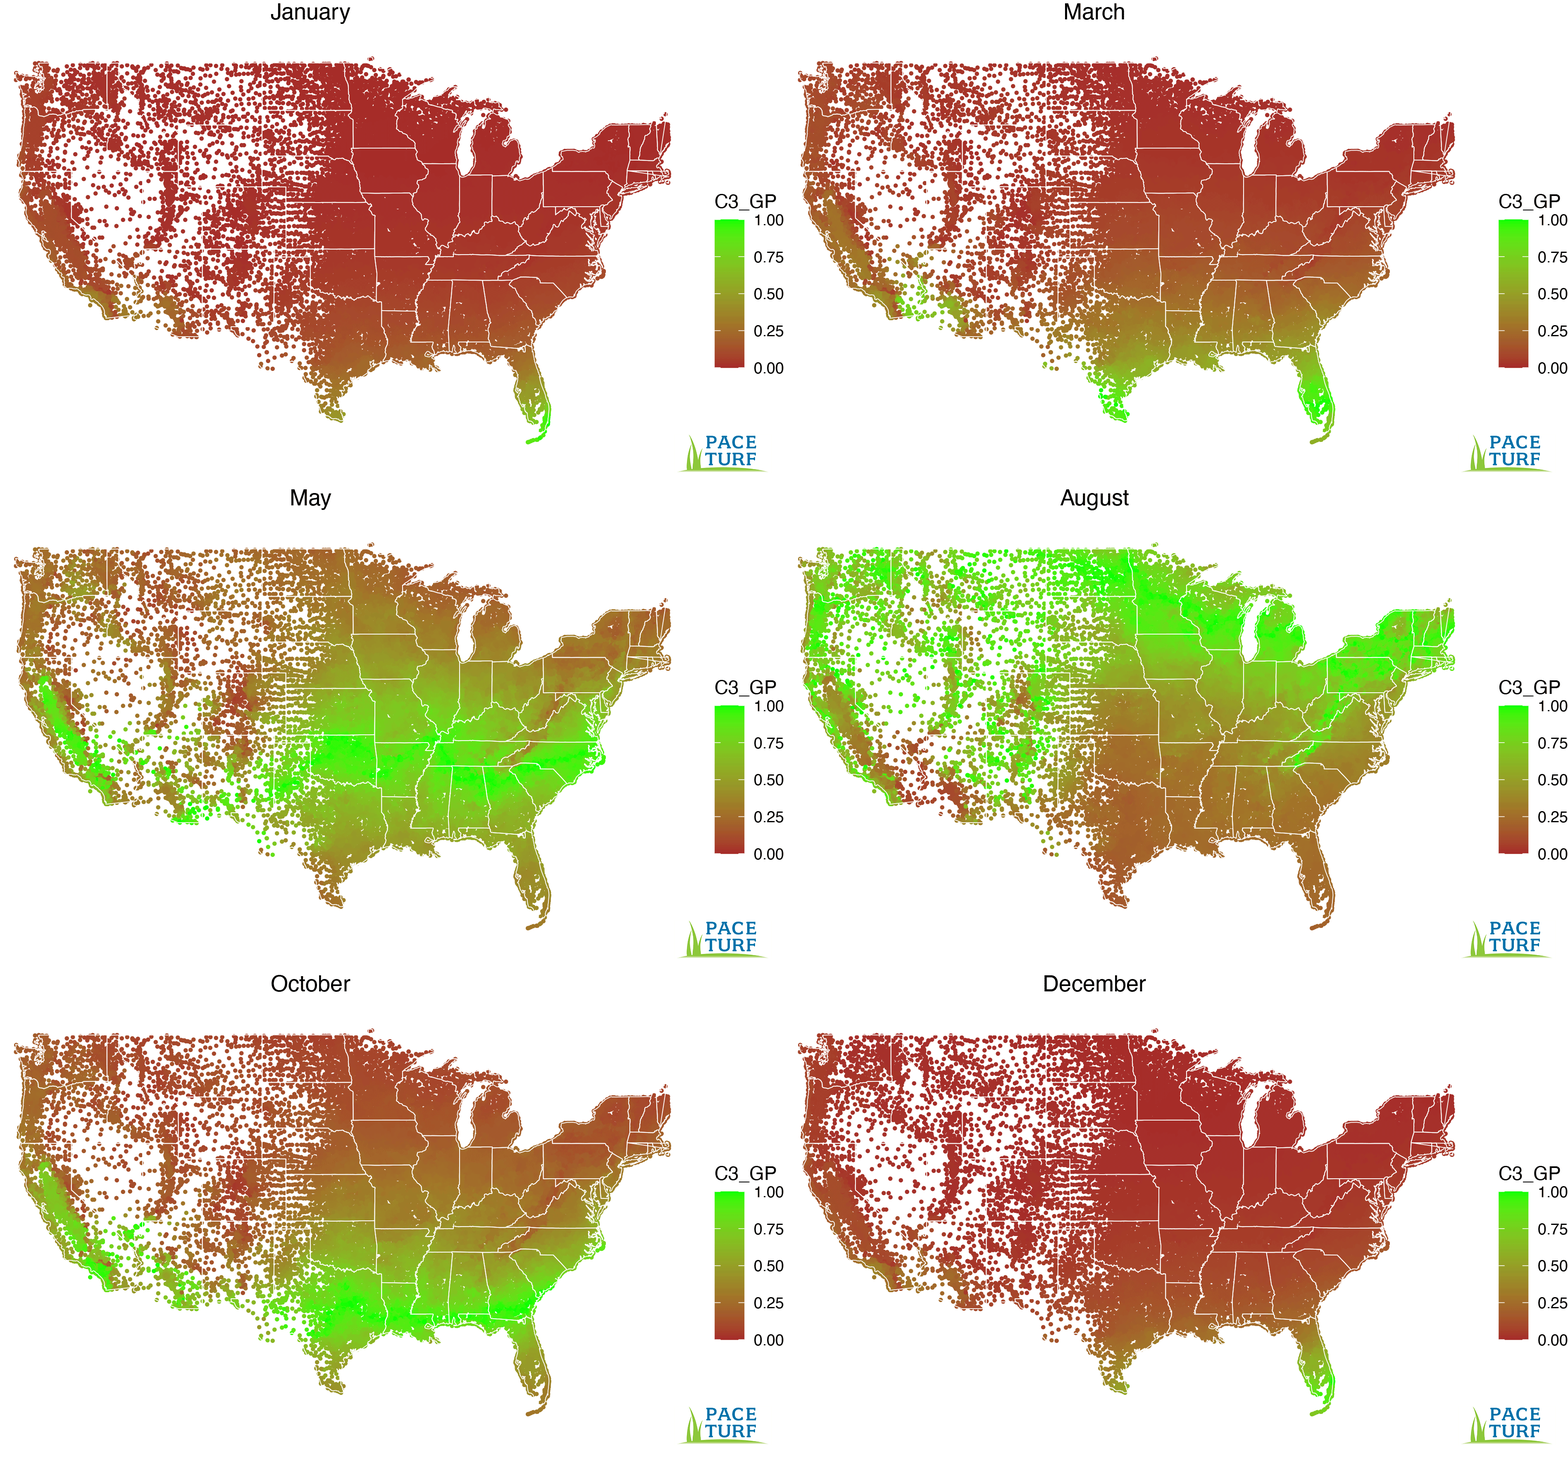
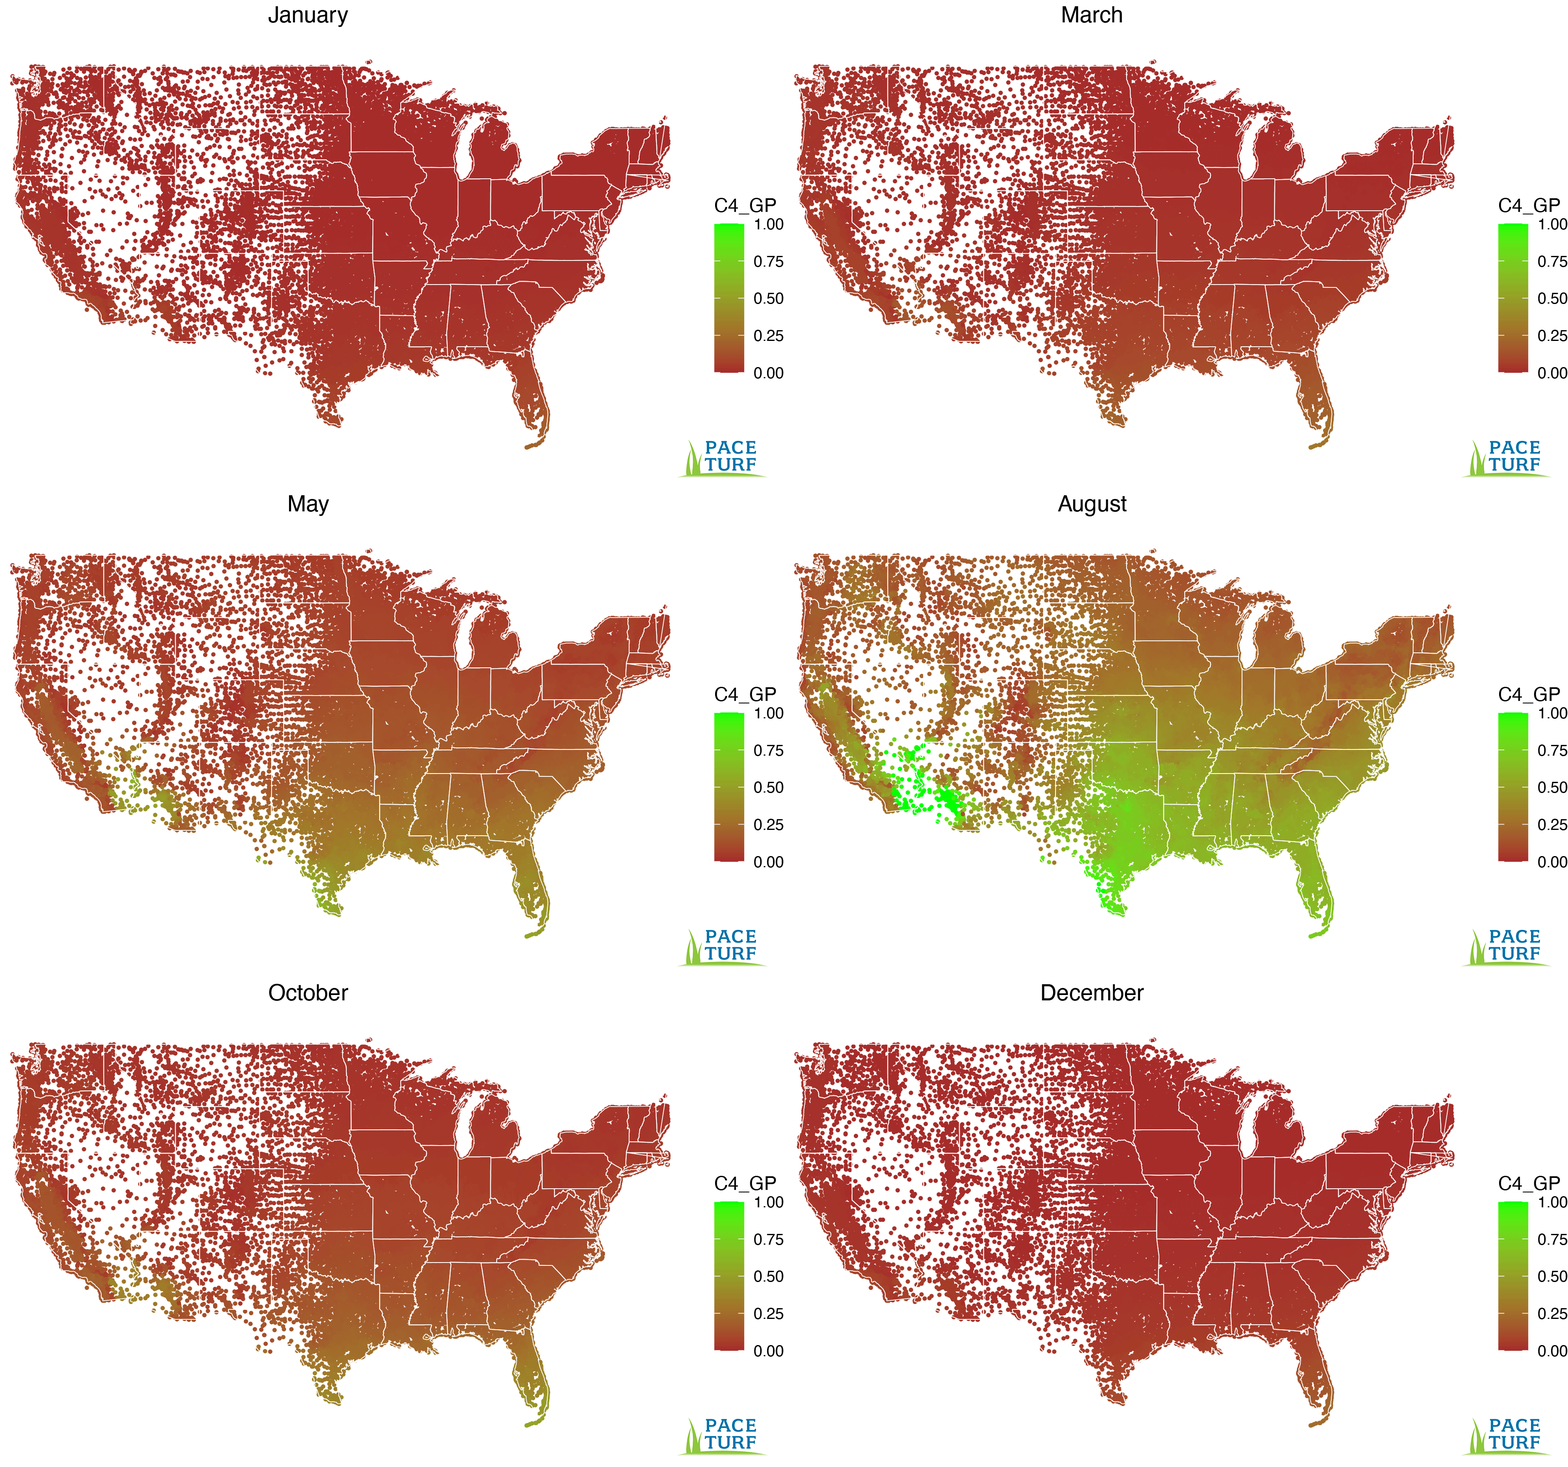
The animated GIFs for cool season grasses (C3_GP) and warm season grasses (C4_GP) were created by plotting Growth Potential (GP) based upon 30 year normal average monthly temperature (data from National Oceanic and Atmospheric Administration 1950-1980 - tempertures are likely a little higher now, but the trends will be similar) for each zipcode by latitude and longitude. There are about 40,000 data points plotted per month. The GP model has been modified a couple of times over the years, most recently to maximize C4 growth potential when average temperature exceeds the estimated optimum temperature for C4 grasses (88 F or 31.1 C). Refer to this graph for an illustration of the GP model functions.
 |
 |
MLSN and GP at the 2017 GIS
Jason Haines (@PenderSuper on Twitter) and Larry Stowell (@paceturf on Twitter) taught a half-day course on Minimum Levels for Sustainable Nutrition (MLSN) guidelines and Growth Potential (GP) to more than 100 golf course superintendents from around the world. The slide presentation and handout materials used for the course have been provided at the links below:


