S-curve with sand particle size of topdressing sand and OM2 sand
 View Larger
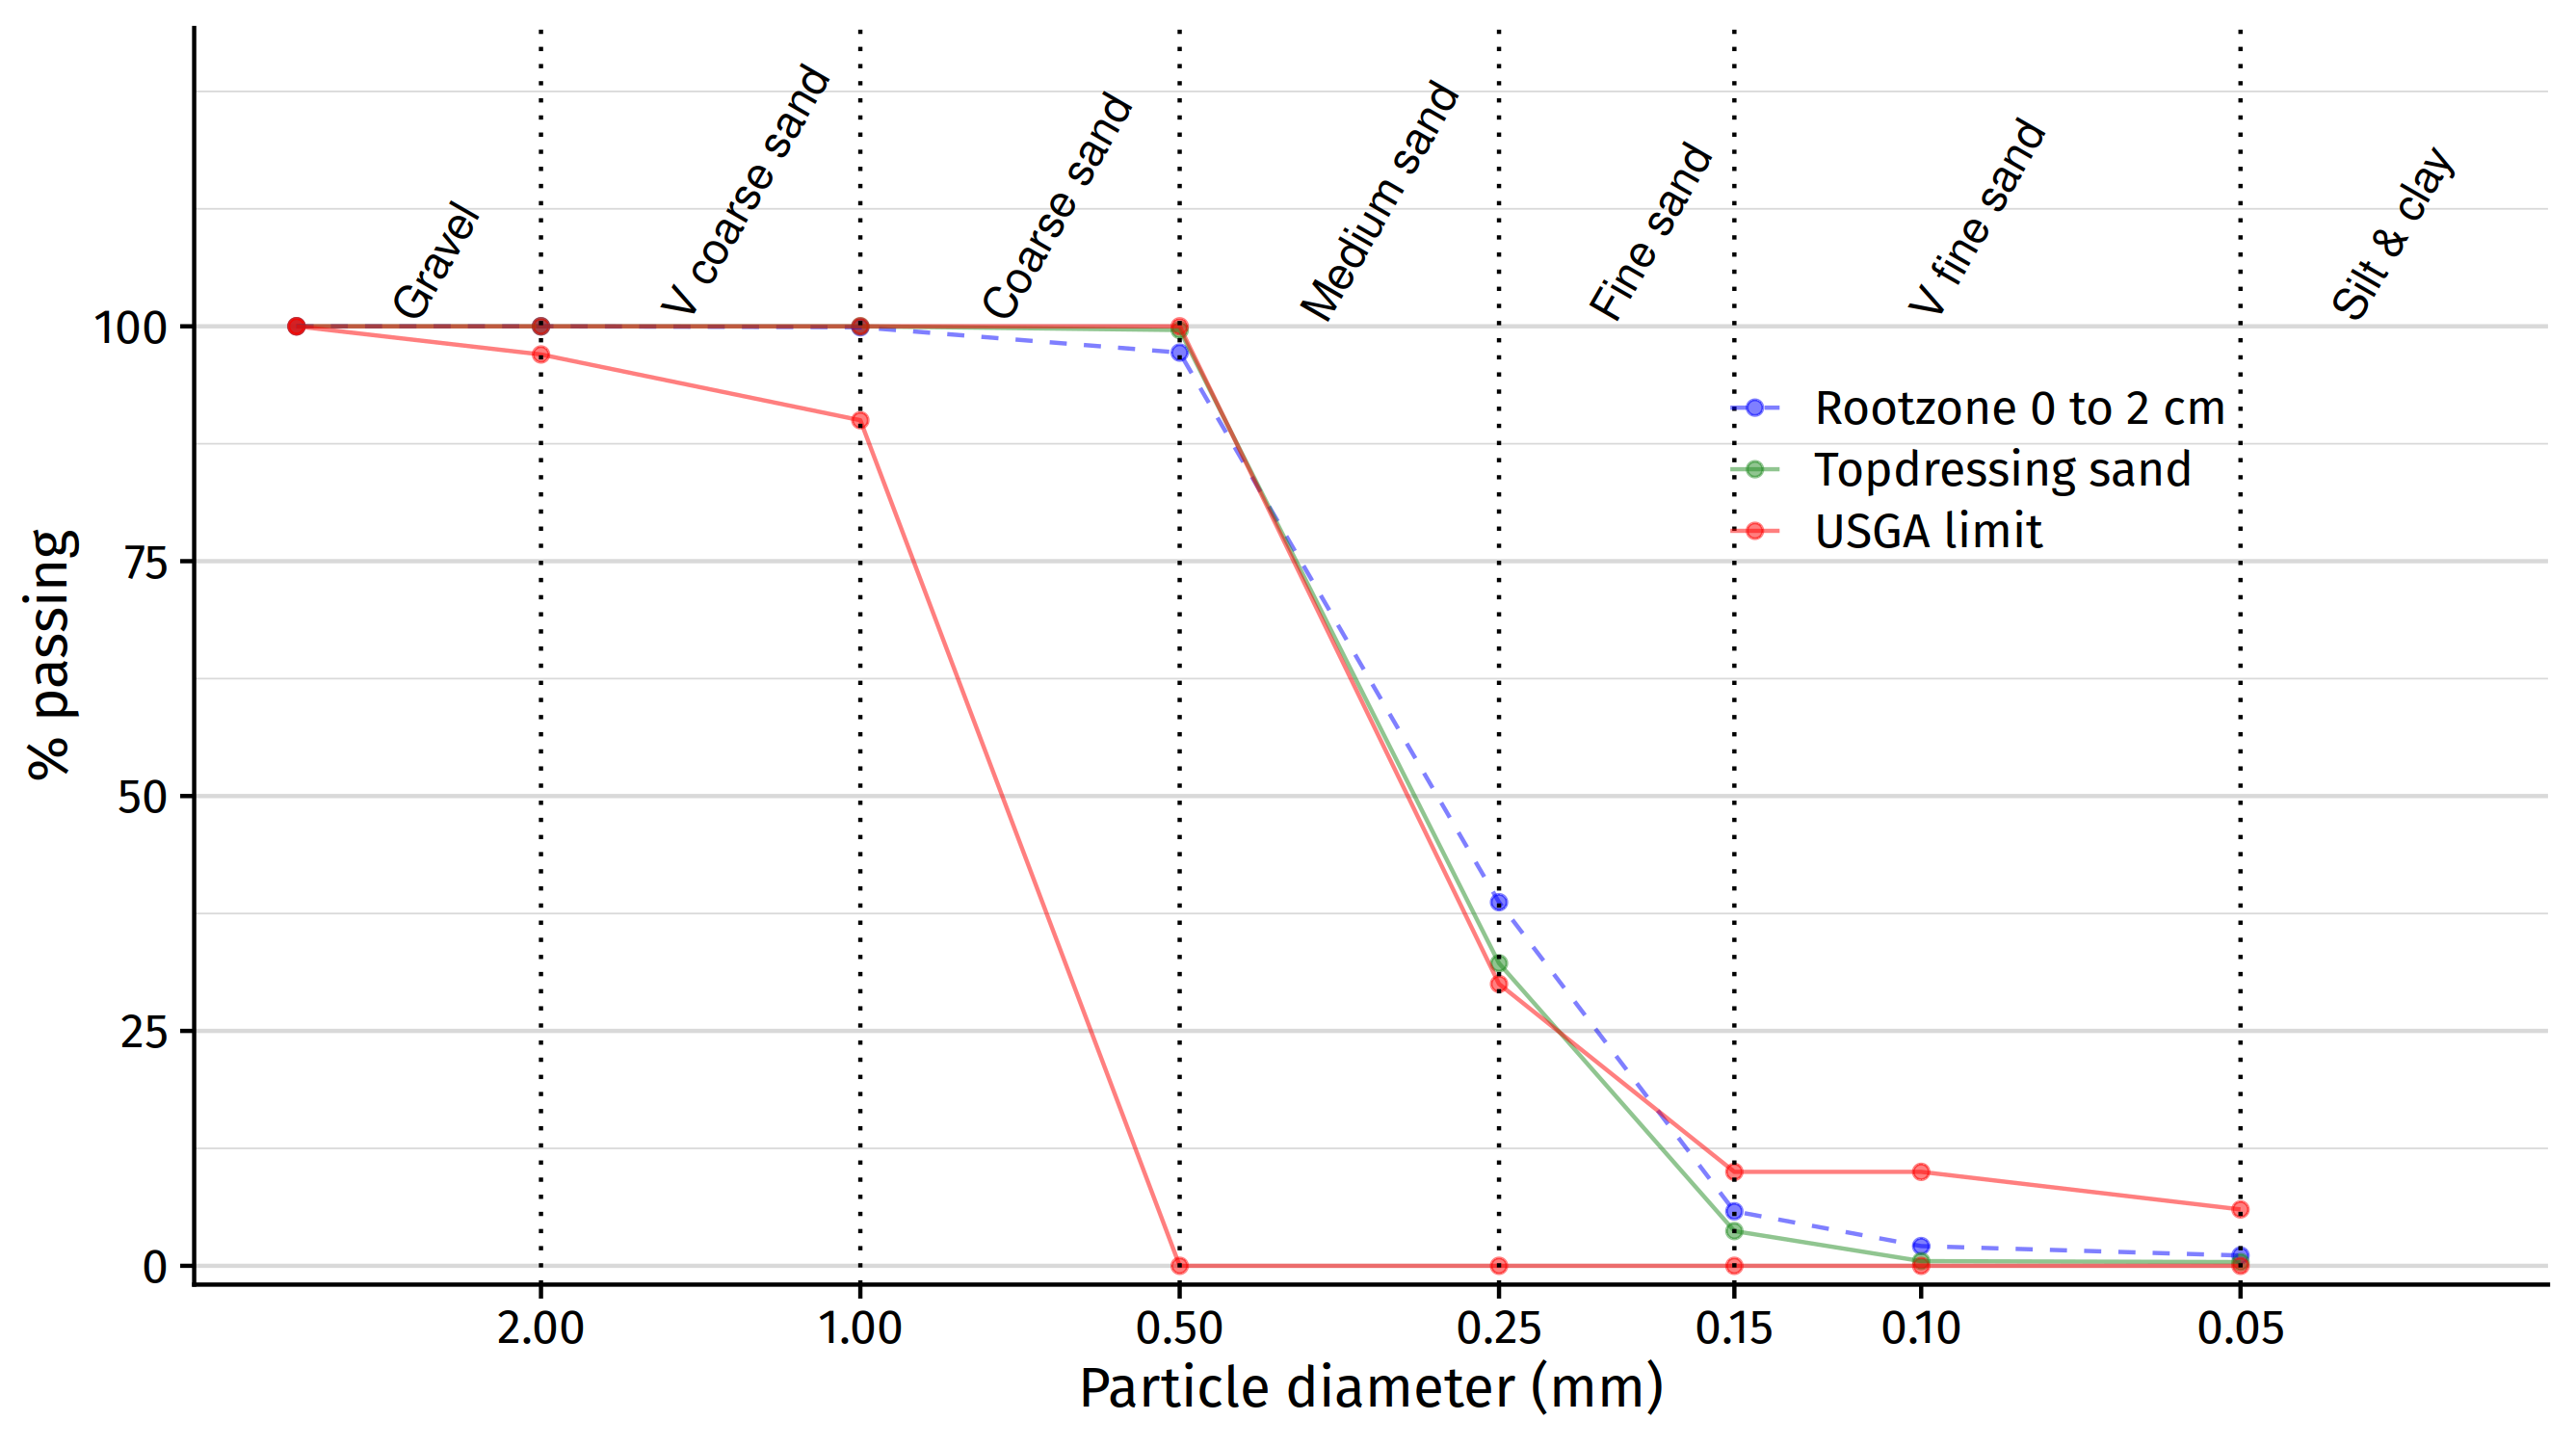
This chart shows the percentage of material passing each sieve size, creating an S-shaped curve. This is one way to plot particle size distributions, and by looking at where the line falls, one can note a few things. For example, the higher or the farther to the right the point is, that would be a finer material. The coarser materials will be lower and to the left.
One can check how a particular sand fits against the USGA Recommendations fine or coarse limits. One can also see how a sand changes over time, or how the topdressing sand differs from the sand in the rootzone. This shows a topdressing sand plotted along with the sand fractions from the top 2 cm of the rootzone after an OM246 total organic material test. Both materials are close to the USGA Recommendations fine limit; by looking at the chart it is evendent that the rootzone material is slightly more fine than the topdressing sand.


