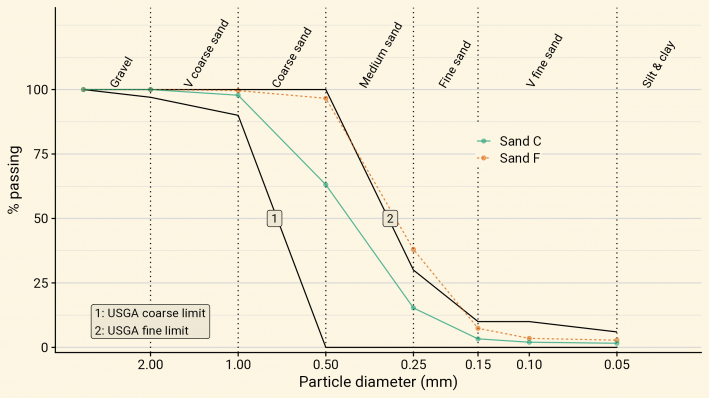
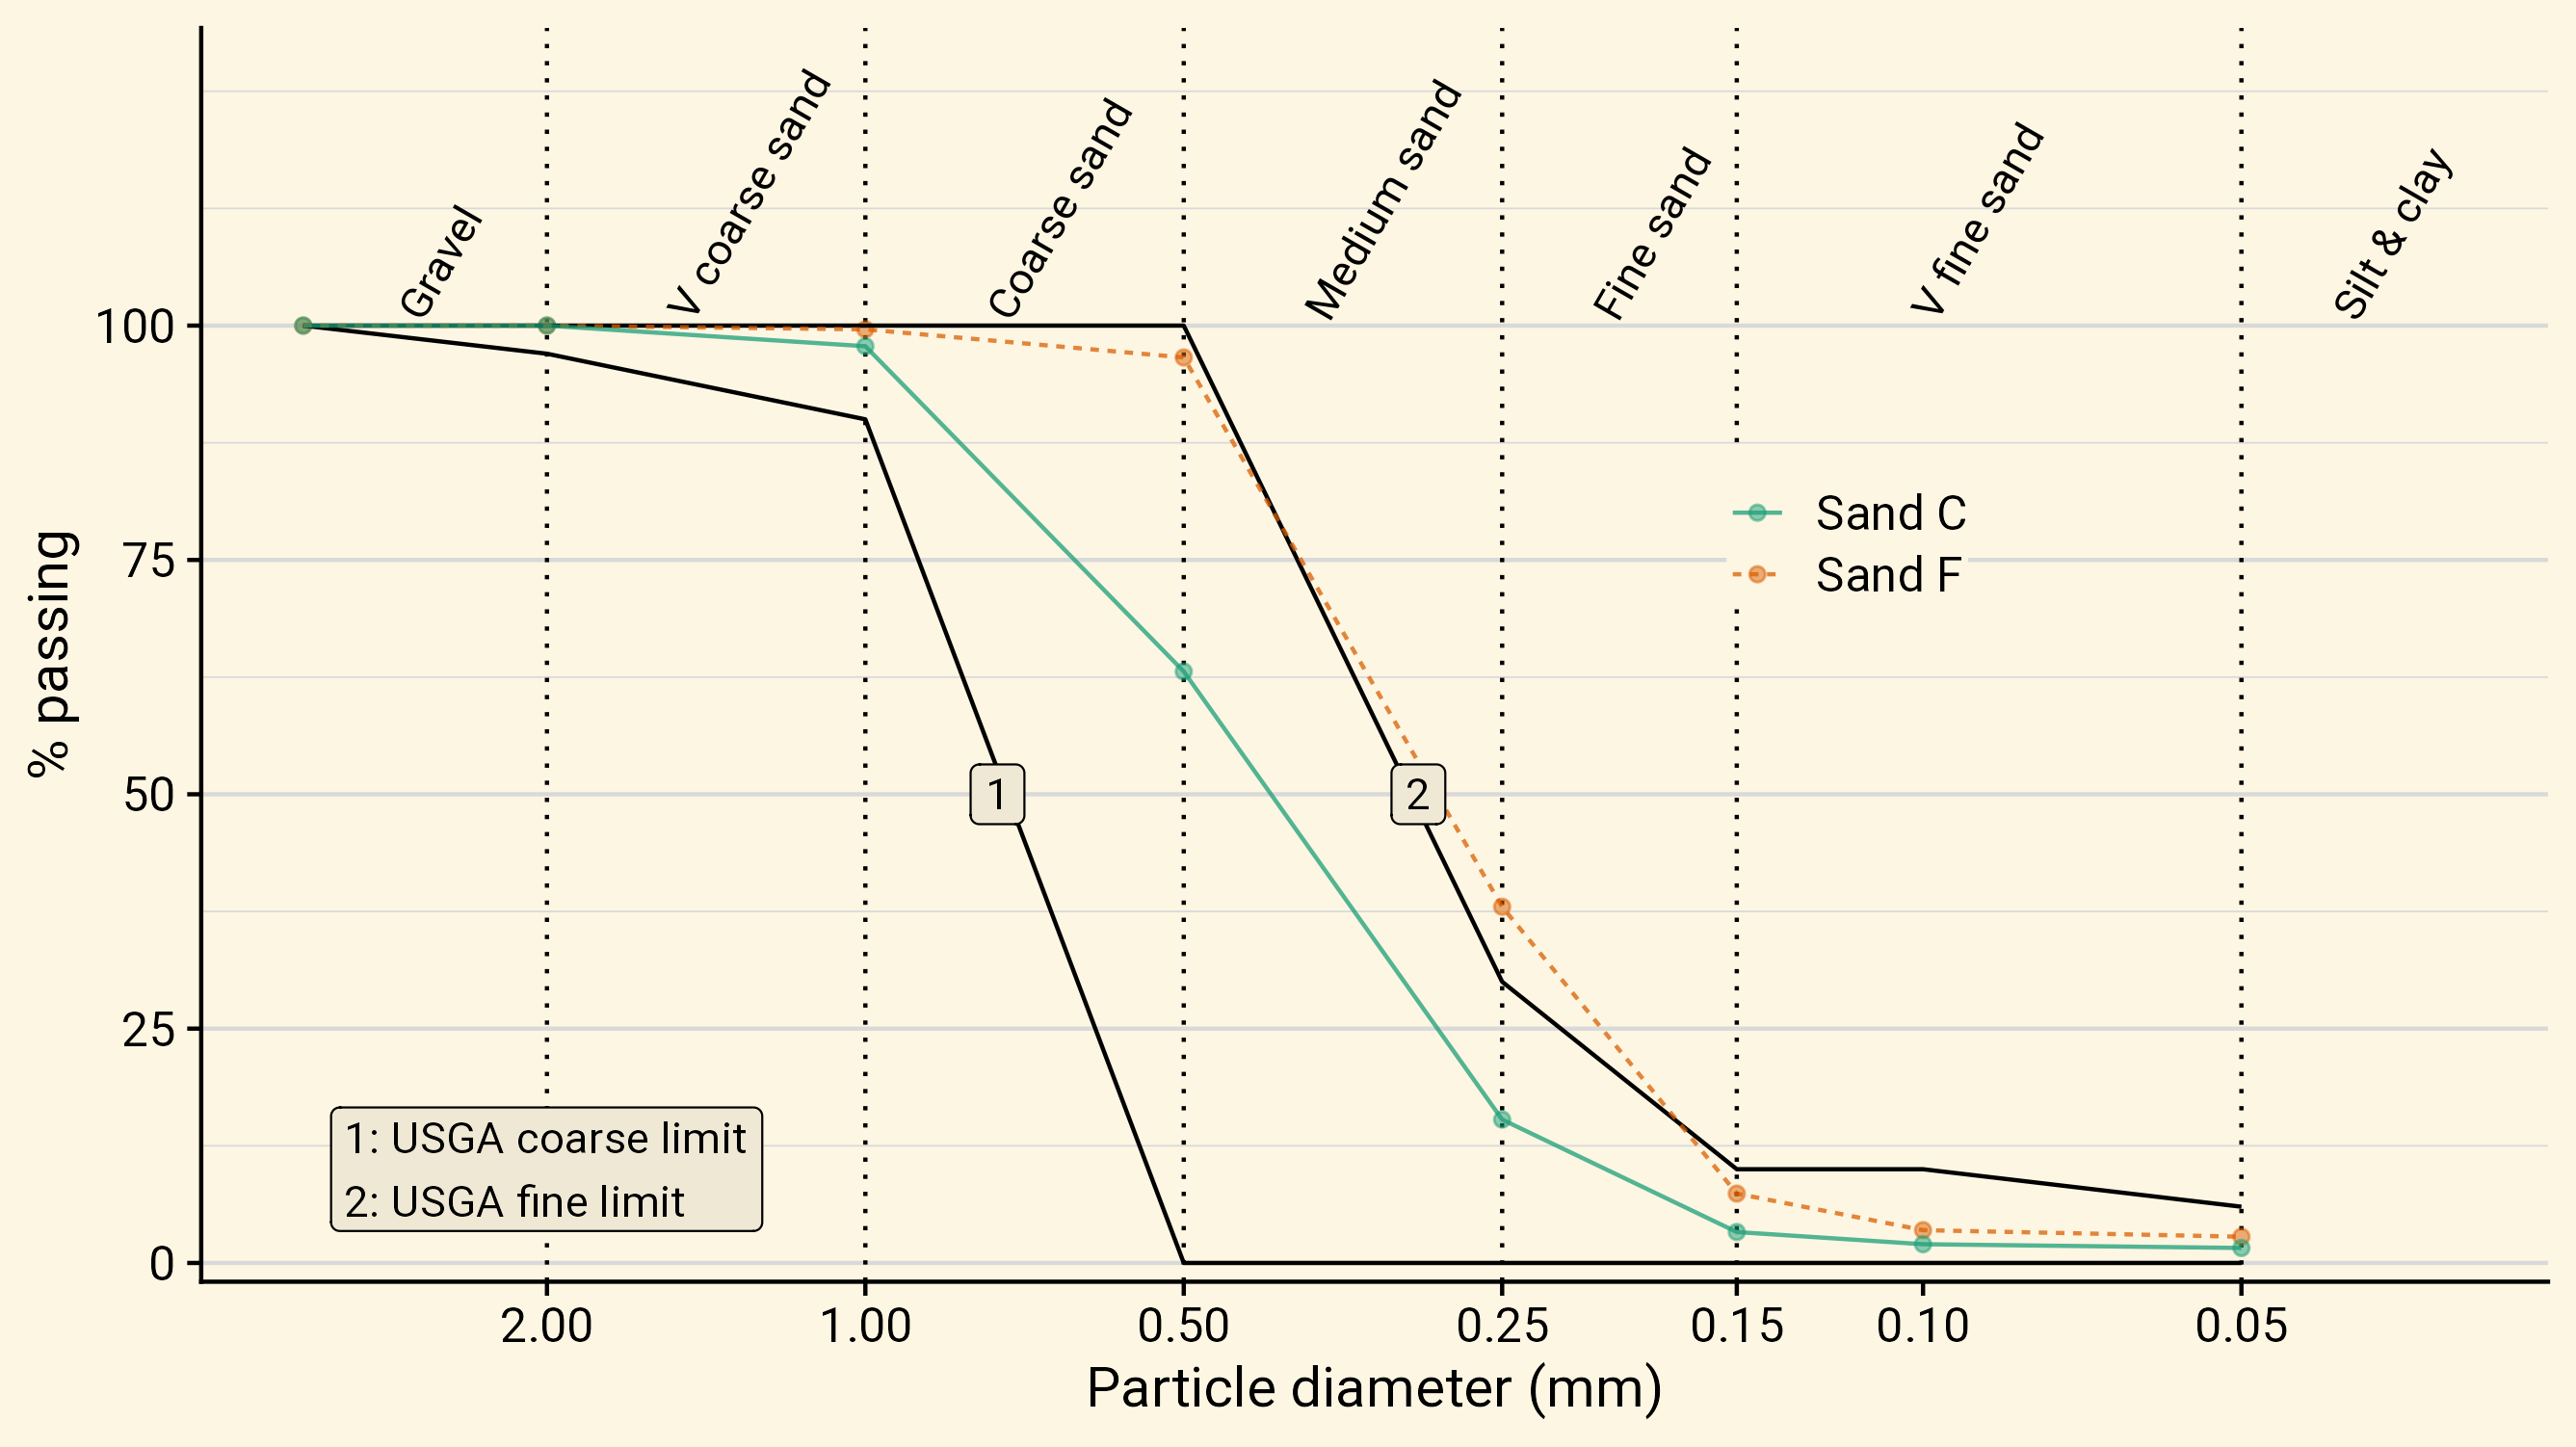
Particle size distribution curve for 2 sands
 View Larger
This chart is a particle size distribution curve that can be read from top to bottom (or bottom to top) as the cumulative percentage of material in the sample passing a sieve of a given particle size. Material that is coarser will be shifted to the left and lower on this chart. Material that is finer will be shifted to the right and higher on the chart.


