Coefficient of uniformity for rootzone sand samples from golf course putting greens
 View Larger
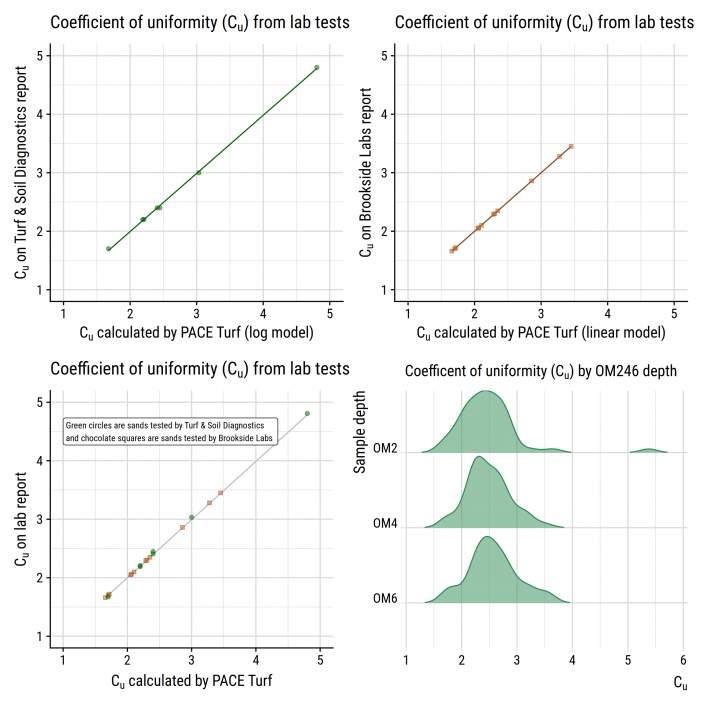
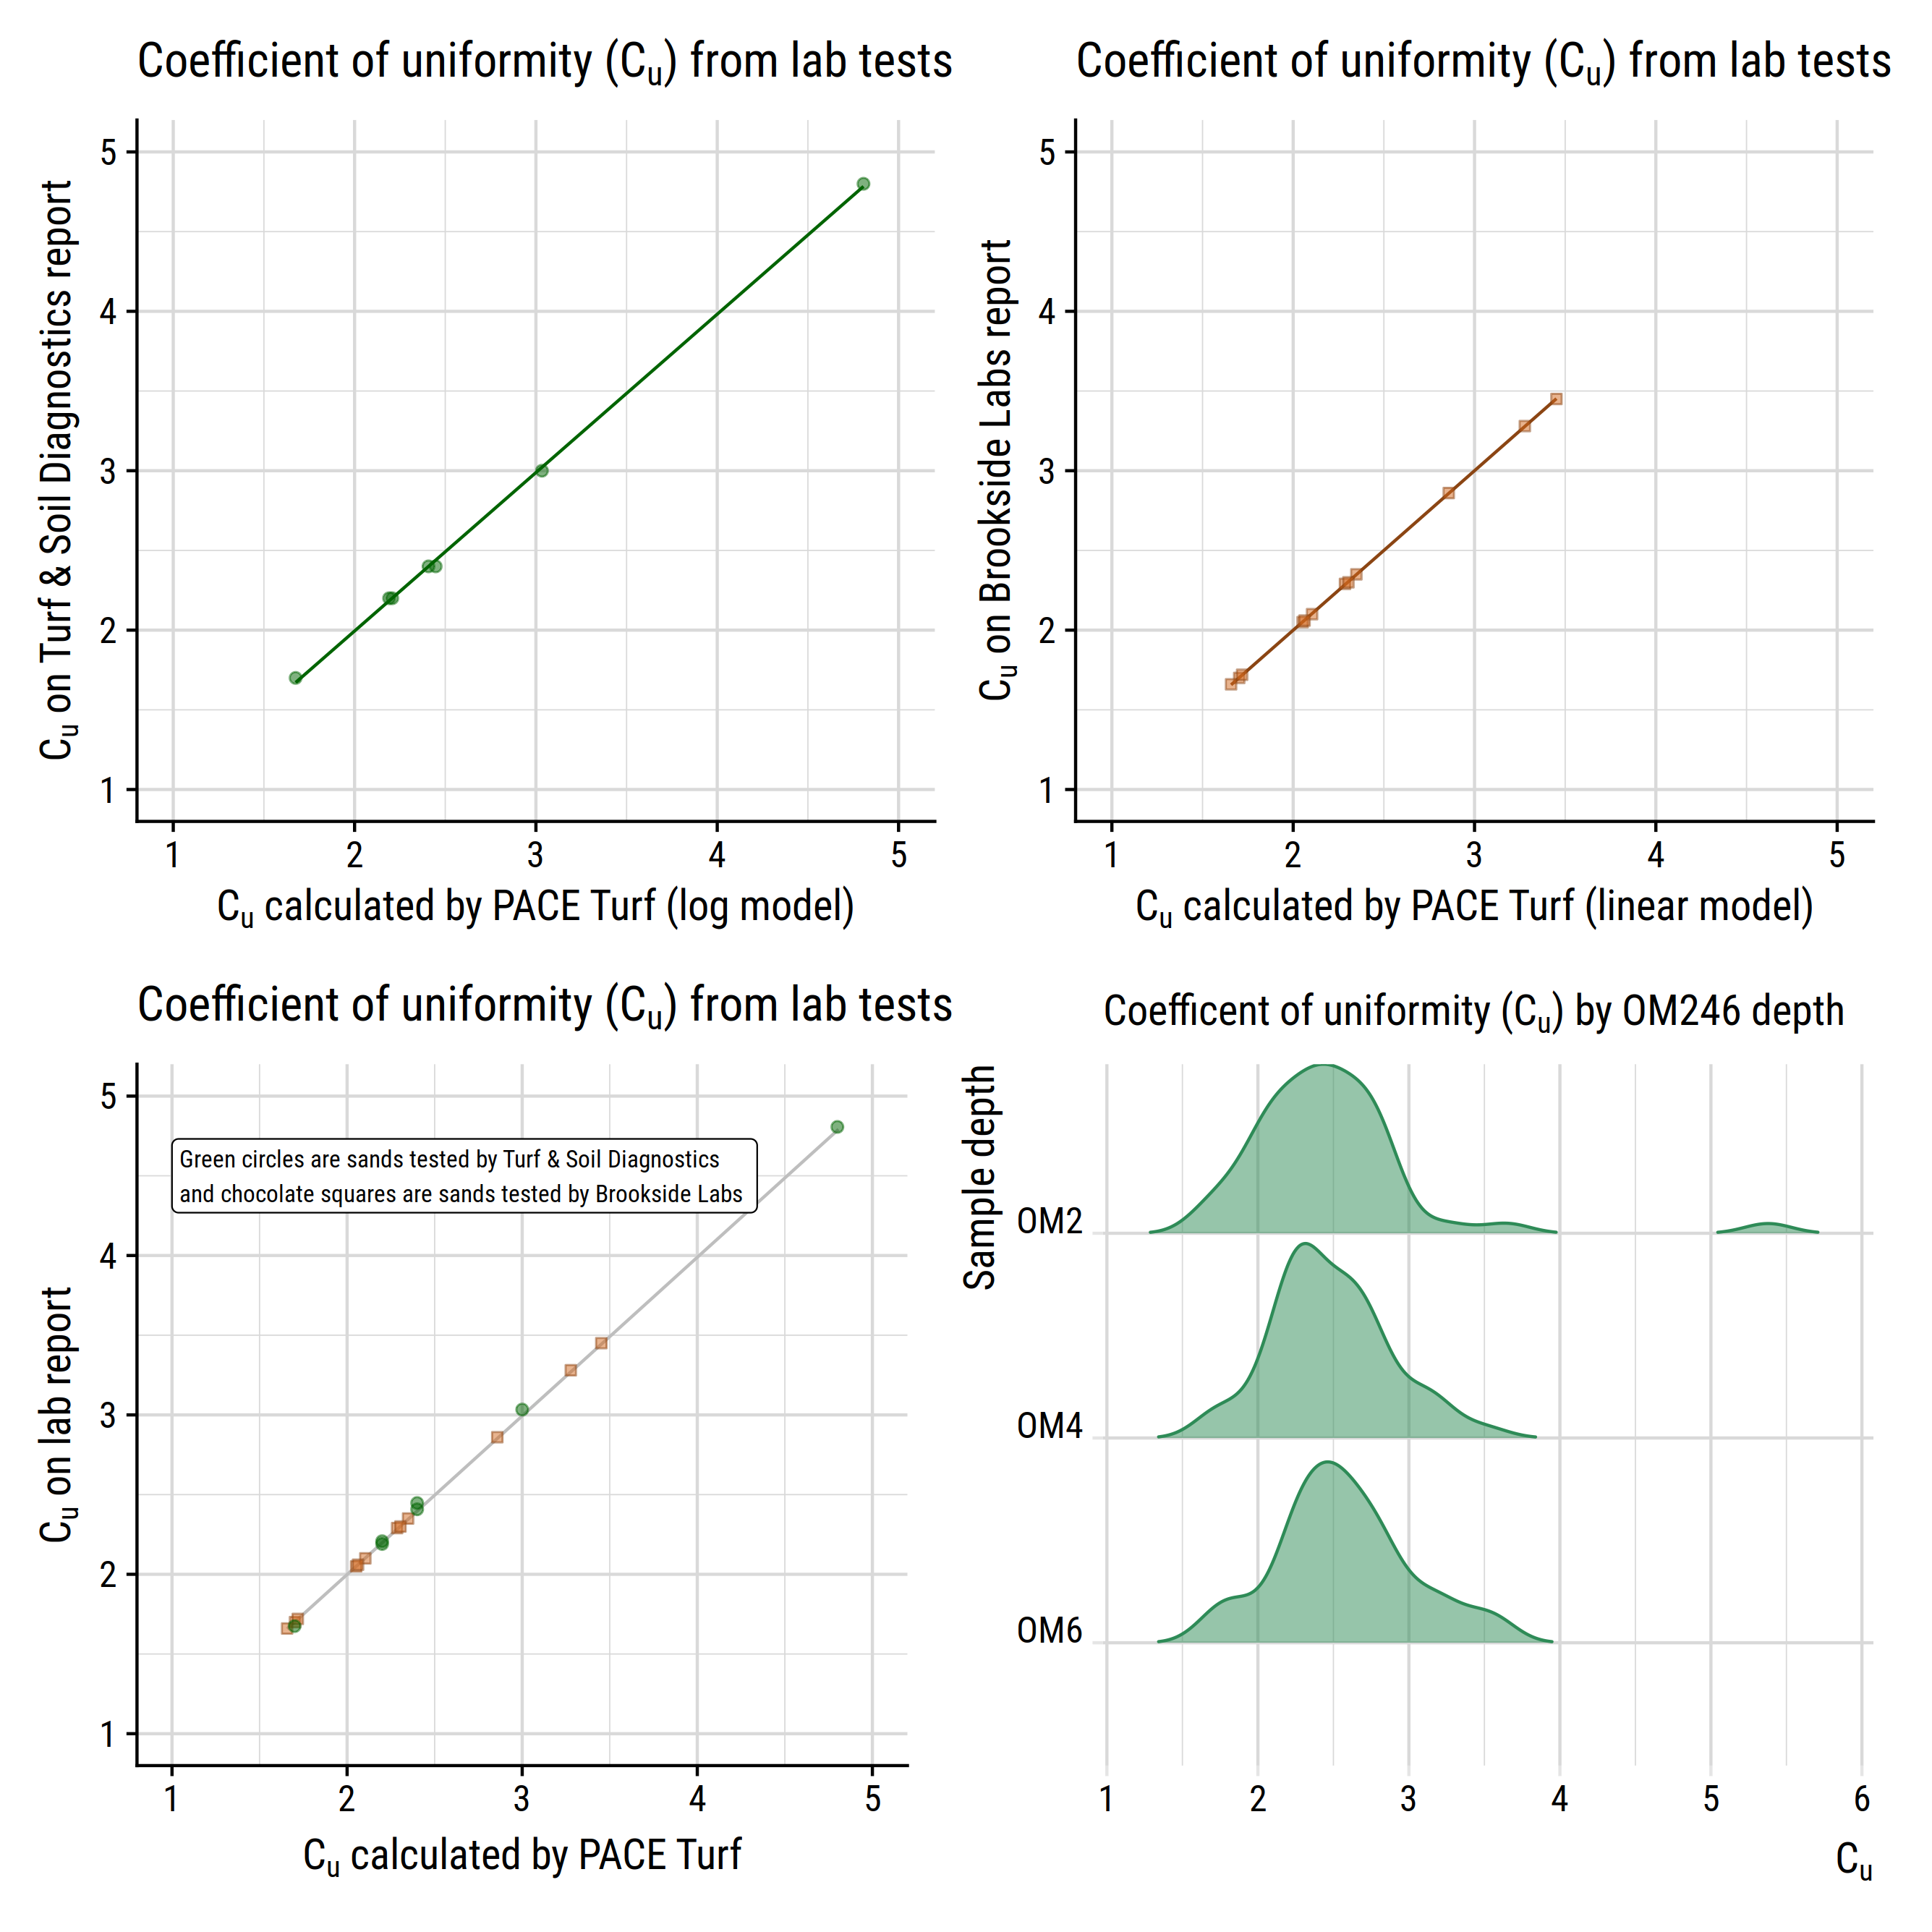
The four frames of this chart show coefficient of uniformity (Cu) values from putting green rootzone sands.
The frame at top left shows test results from Turf & Soil Diagnostics, while the frame at top right shows results for sands tested at Brookside Labs. The frame at bottom left shows the results from both labs. I made these charts because I wanted to double check my calculations to make sure I could calculate the Cu from the particle size analysis data.
The frame at bottom right shows density plots for Cu from the 0 to 2 cm (OM2), 2 to 4 cm (OM4), and 4 to 6 cm (OM6) layers from 50 different putting green rootzones in Asia, North America, and Europe.


