Example soil test chart
 View Larger
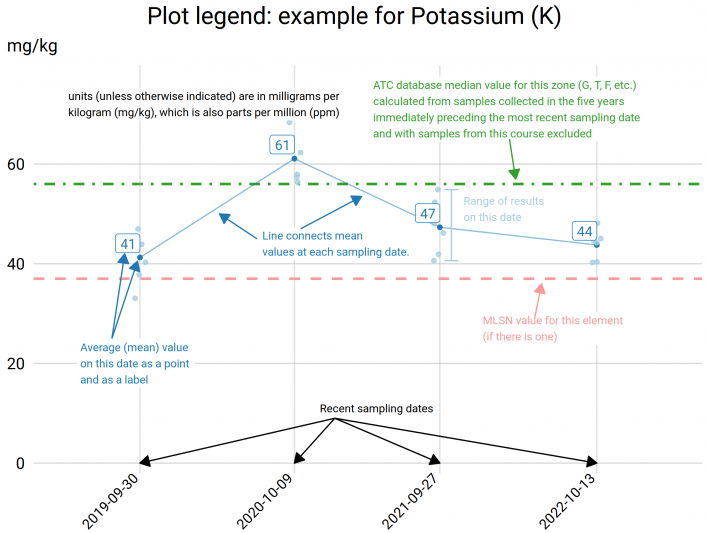
This example chart shows some of the information that will ideally be on soil test charts. These include:
- normal values for that element
- a timeline of historical results from this site up to the most recent test
- some indication of the variability in the test results at the site
- a minimum or maximum level that one should be aware of, if such a level exisits for that element


