Turf Guidelines
University research location climate appraisals
University research results are valuable tools for developing turfgrass management plans. One way to bring more confidence in application of university research data to your site is to understand the type of climate (cool season, warm season or transition) each research location is located in. This PACE Update provides climate appraisal information for most of the major universities to allow you to compare your climate to each of the university research locations. Compare the GP Avatars (Growth Potential Avatars) for each university's location below to your own, provided on the PACE Turf Weather page. For more in-depth comparisons, you can also compare the Climate Appraisals, nutrient plans and normal weather patterns for each university vs. those provided for your location on your PACE Turf Weather page. In addition to reviewing climate impacts when reviewing research on variety trials or disease control practices, you can compare experimental nutritional inputs to the expected turfgrass use in the nutrient plans at each location to help better evaluate the value of these models and how they might apply to your location.
| GP Avatar | Location | Climate US or Metric | Nutrient plan C3 US or Metric | Nutrient plan C4 US or Metric | Delta GP (C3-C4) | |||
| University of Arizona | US | Metric | US | Metric | US | Metric | Delta | |
| University of Arkansas | US | Metric | US | Metric | US | Metric | Delta | |
| UC Riverside | US | Metric | US | Metric | US | Metric | Delta | |
| Colorado State University | US | Metric | US | Metric | US | Metric | Delta | |
| University of Georgia | US | Metric | US | Metric | US | Metric | Delta | |
| Purdue University | US | Metric | US | Metric | US | Metric | Delta | |
| Iowa State University | US | Metric | US | Metric | US | Metric | Delta | |
| University of Maryland College Park | US | Metric | US | Metric | US | Metric | Delta | |
| University of Massachusetts Amherst | US | Metric | US | Metric | US | Metric | Delta | |
| University of Michigan | US | Metric | US | Metric | US | Metric | Delta | |
| Universiy of Nebraska | US | Metric | US | Metric | US | Metric | Delta | |
| Rutgers University | US | Metric | US | Metric | US | Metric | Delta | |
| New Mexico State University | US | Metric | US | Metric | US | Metric | Delta | |
| North Carolina State University | US | Metric | US | Metric | US | Metric | Delta | |
| Ohio State University | US | Metric | US | Metric | US | Metric | Delta | |
| Oregon State University | US | Metric | US | Metric | US | Metric | Delta | |
| Pennsylvania State University | US | Metric | US | Metric | US | Metric | Delta | |
| Clemson University | US | Metric | US | Metric | US | Metric | Delta | |
| Texas A&M University College Station | US | Metric | US | Metric | US | Metric | Delta | |
| Utah State University | US | Metric | US | Metric | US | Metric | Delta | |
| Virginia Tech | US | Metric | US | Metric | US | Metric | Delta | |
| University of Wisconsin | US | Metric | US | Metric | US | Metric | Delta | |
MLSN Guidelines
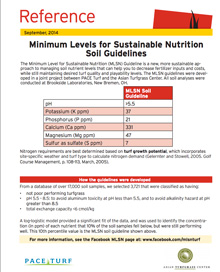
Increased economic and environmental pressures have caused many turfgrass managers to re–assess the way you manage turf. With fertilizers as one of the bigger inputs, we felt that it was time to review and revise our current soil guidelines to reflect these changes. The result is the "Minimum Level for Sustainable Nutrition" (MLSN) soil guidelines, a new, more sustainable approach to managing soil nutrient levels that can help you to decrease inputs and costs, while still maintaining desired turf quality and playability levels. Used in conjunction with Climate Appraisals and Growth Potential, annual fertilizer needs can be estimated.
Working together with Dr. Micah Woods of the Asian Turfgrass Center, the guidelines were produced through review of key soil nutrient data from thousands of turf soil samples. Based on our evaluations, we determined that in many cases, guidelines could be safely lowered without a dramatic impact on turf quality or playability.
Since their introduction in 2012, the MLSN guidelines have been adopted by turf managers around the world, who have been surprised to find just how "low they can go" as they more precisely target the nutrient levels that the turf needs.
Scientific basis for the MLSN Guidelines:
- Woods MS, Stowell LJ, Gelernter WD, 2016. Minimum soil nutrient guidelines for turfgrass developed from Mehlich 3 soil test results. PeerJ Preprints 4:e2144v1 https://doi.org/10.7287/peerj.preprints.2144v1
- Stowell, L. and Woods, M. 2014. Minimum levels for sustainable nutrition. Bouyoucos Conference
- Stowell, L., Woods, M. and Gelernter, W. 2014. Only what the turf needs: updating the Minimum Levels for Sustainable Nutrition Guidelines. Crop Science Society of America meetings, November 5, 2014.
Turf management articles about the MLSN Guidelines:
- Woods, M. 2018. New MLSN Cheatsheet. Asian Turfgrass Center
- Woods, M., Stowell, L. and W. Gelernter, 2014. Just what the grass requires: using minimum levels for sustainable nutrition. Golf Course Management, January, 2014.
- Haines. J. 2014. Sustainable fertilizer use.
- Thayer, A., 2013. Cut costs with better turf management. Western Turf, Winter, 2013.
- Gelernter, W., Stowell, L and Woods, M. 2013. Documenting your progress toward sustainability. Golf Course Management, December, 2013.
Websites with more information about the MLSN Guidelines:
Top Ten Turf Monitoring Tools
OK, so we couldn’t stop at 10. Once we got started listing tools that we have found to be effective, that are easy to use and to acquire, and that are relatively inexpensive, we found at least 15 turf monitoring tools that we think should be in every superintendent’s arsenal.
This information was presented in the "Answers on the Hour" Session at the February, 2011 Golf Industry Show in Orlando. For those of you that didn’t attend the session, please feel free to download and print this handout (131 KB pdf) for further information.
Intrigued by the weird designs on the back of the handout? These QR codes are a type of bar code that can be rapidly scanned with your smart phone’s camera to gain immediate access to a website. The codes on the back of the handout correspond to the websites of each of the manufacturers listed on the front of the handout as sources for the tools that we recommend.
Although some phones have built in QR readers, iPhone users will need to download a QR application (usually free or under 2 dollars). To find out what you need for your phone, just do an online search for the model of your phone, followed by the words QR reader.
Not a PACE Turf member yet?
For more information on how PACE Turf’s member website, emails and videos can help you get the answers you need, please take the tour of PACE Turf member services, visit our home page or read what other turf managers have to say about the benefits of membership.
How we review products and practices
Selecting which product or practice will perform the best for you is one of the most important — and also one of the most difficult— decisions that turf managers face. The fact that some materials are marketed with little or no data, or with misleading data, complicates your decision ten-fold.
One of our main goals is to supply PACE Turf members with science–based guidance on the efficacy of turf products, practices and management strategies. Whether we are reviewing the performance of gray leaf spot control agents, sod webworm products or strategies for moss control, we always provide a listing of the options that will perform best, in our analysis.
But how do we determine which strategies to recommend, and which to omit from our publications and presentations? The internal guidelines shown below were developed here at PACE Turf over the past 30 years, and, because they are based in the scientific method, they give us confidence that the recommendations that we pass along to you are as useful and dependable as possible. The guidelines below may also be useful to each of you in product selection decisions, as well as in communicating to vendors the standards that you will use to evaluate the products that they are promoting.
PACE Turf internal guidelines for development of turf management recommendations:
- Each research trial must have a detailed protocol that describes the objectives of the study, as well as detailed materials and methods that include statistical analytical methods and experimental design parameters.
- Treatments must be replicated and include appropriate non–treated controls. In addition, current method(s) of choice should be included for purposes of comparison.
- Trials should be conducted, supervised or coordinated by a qualified independent researcher or consultant (university or extension researchers, Certified Crop Advisors, Certified Professional agronomists, Certified Soil Scientists, independent researchers with a minimum of a B.S. in agricultural or related sciences). Publication record in peer reviewed science journals is a plus. Unknown researchers are required to supply a resume and references with their research reports.
- Raw data must be provided by researchers to PACE Turf upon request. PACE Turf may re–analyze raw data to confirm conclusions.
- The product or practice should be tested in multiple locations (a minimum of 3) and, if feasible, in multiple environmental regions.
- Products that are selected for use in PACE Turf management recommendations must show a substantial positive effect. A statistically significant response alone is not sufficient, as it does not necessarily show that the product will provide a useful and practical solution for PACE turf clients.
- Data cannot be "cherry–picked" so that only favorable data is provided for review, and negative data is withheld.
IPM Planning Tools
IPM Planning can be a tedious task. However, once your first IPM Plan has been created, the major work has been done. The information provided below was developed for the first version of the GCSAA IPM Template. That planning template has not been supported by the GCSAA, but the information below is stil useful. We will be reviewing some of these resources and updating the documents throughout the year. We hope this information will assist you with development of a site-specific IPM plan for your location.
The spreadsheets, references and procedures below were developed, with support from a GCSAA grant, to assist superintendents in creating an IPM Plan for their golf courses. The project was completed and attempts to update the project have failed. However, the template draft and instructions below are still useful when developing an IPM plan for your facility.
Instructions for completing the IPM Template (291 KB pdf)
Pest, Soil and Water Management References (1.7 MB pdf)
The following forms are available for use in constructing your IPM Template
Electronic entry forms:
- Climate Appraisal Form: English units (electronic entry, 12 KB, xls file)
- Climate Appraisal Form: metric units (electronic entry, 12 KB, xls file)
- Goal Setting Form (electronic entry form, 82 KB doc file)
- Management Zone Inventory Form (electronic entry form, 108 KB doc file)
- Management Zone Performance Record (electronic entry form, Excel file)
- Electronic entry forms for IPM Planner, Pest Worksheet and Budgeting Worksheet (84 KB Excel File)
- Spreadsheet for tracking pesticide toxicity class totals (pounds) (Excel File)
- Spreadsheet for tracking pesticide toxicity class totals (kilograms) (Excel File)
- Spreadsheet for calculating pounds active ingredient in pesticide formulations (Excel file)
Printable forms:
- IPM Planner (printable form, 37 KB pdf)
- Pest Worksheet (printable form, 38 KB pdf)
- Budgeting Worksheet (printable form, 35 KB, pdf)
- Goal Setting Form (82 KB doc file)
- Management Zone Inventory Form (108 KB doc file)
Examples of completed forms for IPM Planner, Pest Worksheet, Climate Appraisal and Budgeting Worksheet
- Southern California:
- Southern California Pest Worksheet and IPM Planner (88 KB Excel File)
- Maryland: Maryland IPM Planning resources
- Vermont:
- Vermont Pest Worksheet and IPM Planner (57 KB Excel File)
- Vermont Climate Appraisal (12 KB Excel File)
- Illinois:
- Illinois Pest Worksheet and IPM Planner (52 KB Excel File)
- Budget Worksheet Example (Illinois) (Excel File)
- Spreadsheet for tracking pesticide toxicity classes (Illinois Example) (pdf file)
- Illinois Climate Appraisal (12 KB Excel File)
- Management Zone Performance Form Example (Illinois) (pdf)
Turf growth potentials: a tool with many uses
We developed the growth potential model to explain myriad of ways in which weather impacts turf growth. The model considers turf growth to be good when the growth potential (GP) is between 50% and 100% (the best possible growth occurs at a GP of 100%). However, when weather conditions are either too hot or too cold for optimal turf growth, the GP falls below 50%, and turf becomes progressively more stressed. When the GP falls to 10% or lower, growth is extremely limited. We have listed a few of the many uses of growth potentials below.
- Timing application for chemical transition accelerators (Kerb, Revolver, Monument, Manor, Blade, TranXit): Warm-season turf GP should be 50% or higher at the time of application in order to ensure that sufficient warm-season turf cover is present.
- Scheduling aggressive management practices (aerification) or stressful events (tournaments): Turf growth potential should be as high as possible (greater than 50%) and on the rise when stressful events are scheduled. This allows for the greatest recovery potential of the turf.
- Explaining why cool- or warm-season turf is performing poorly (or well).
- After a heat spell, predicting how long will it take for cool-season turf to begin active growth again.
Table of growth potential at different average air temperatures (pdf).
Table of growth potentials in selected US Cities (pdf).
Turf Management Guidelines
Turf growth potential in selected U.S. locations
Turf growth potential at different average air temperatures
EC (electrical conductivity) monitoring for soil salinity
Soil Guidelines and demystifying soil analyses
Soil Chloride and Sulfur Guidelines
Quick test for soil nitrate
We have developed a quick, easy, on-site test that can detect excessive levels of soil nitrates. Although this test does not replace analytical testing, it provides values that are rough estimates of nitrate levels, and should be a useful and rapid diagnostic tool.
Materials needed:
- Hach water test strips for nitrate/nitrite (Cat. # 27454-25, Hach Company, PO Box 389, Loveland, CO 80539. Phone: 800-227-4224. A bottle of 25 strips is $16.29 as of July, 2010.
- Small beaker or container
- Tablespoon
- Soil from problem area and from nearby area of healthy turf
- Notebook for recording data
Procedure:
- Mix equal volumes of soil and tap water (for example, 1 tablespoon of each) in a small container and stir thoroughly. Allow the soil to settle for 1 minute
- Dip the test strip into the soil suspension.
- Allow the strip to develop for 1 minute
- Lightly rinse the strip with water to remove soil
- Compare the color on the tip of the strip to the nitrate nitrogen color chart on the test strip container. Write down the ppm value that you think is closest to the color you see on the strip. This value must be converted to obtain the nitrate concentration (in parts per million) of your soil, using the formula below:
(Dipstick value X 1.5) + 2.9 = Soil nitrate concentration (ppm)
For example, assume that the color on your dipstick indicates roughly 15 ppm nitrate, as it does in this photo. Remember -- the dipstick value needs to be converted to one that is accurate for soil nitrate! The soil nitrate concentration is therefore = (15 X 1.5) + 2.9 = 24.9.
- If the final value is over 20 ppm as it is in the example above, nitrogen applications of all types should be halted until levels are well below 20 ppm. If possible, leach the area to help bring nitrogen levels down more rapidly.
Keep in mind that the dipstick test has several limitations, including:
- It does not test for ammonium levels -- only for nitrate levels. Therefore, even if you have high ammonium levels in your soils, you will get a low reading from the dipstick.
- The test is designed to detect an excess of nitrogen, but it will not detect nitrogen deficits. To determine whether your soils are lacking in nitrogen, the soils should be sent to an analytical laboratory.
- The values you get with this test are rough estimates, at best. For more accurate readings, soils should be sent to an analytical lab for testing.